IMPORTING DATA AND CREATING PROJECTS IN THE LIGHTING CONTROL SYSTEM
ILS is a comprehensive lighting control system. But what does an open system mean? It means the ability to download and add any data to and from the system. You can add to the application, for example: Publicly available data or data from the WMS/WTMS city; Orthophotomap; City study; Administrative boundaries; GEZ areas and others. The limit is your imagination… and access to data.
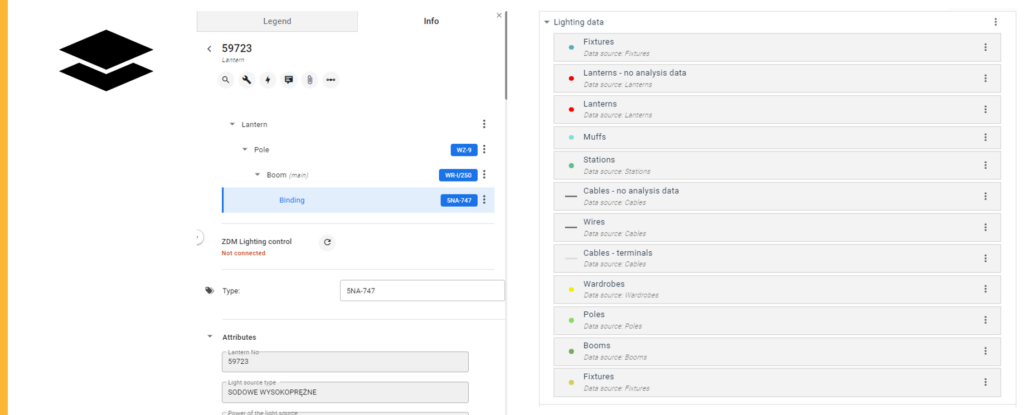
INFRASTRUCTURE DATA (WEB AND FIELD WORK)

The image above shows a view of available layers with data that may or may not be imported into the project. After entering them into the database, it is possible to use them and create “projects” that contain only the most necessary data. Subsequently, such data can be filtered and modified. This is the lighting control system!
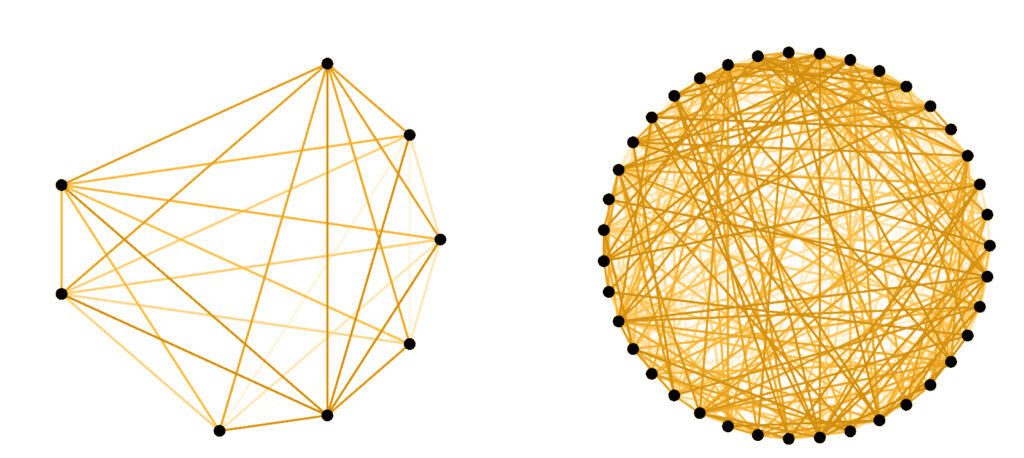
DATA STRUCTURE AND NETWORK LOGIC (RELATIONSHIPS)

DATA UPDATE – EDITOR PANEL VIEW IN ILS LIGHTING CONTROL SYSTEM
Based on the acquired data on street profiles and orthophoto or street view data, the designer is able to assign a street model and enter the data into the program to calculate and select the most appropriate beam and shape of the lighting fixture.
UNIQUE DATA MODEL

To make the entered data valuable and complete, the system carries out a validation process. e.g. adding a lantern: Checking whether the lanterns are attached to the cables; Checking the correctness of the terminals; Checking for a short circuit; Checking whether the introduced lanterns are powered from the cabinet, etc….
CREATING INDIVIDUAL MAP PROJECTS
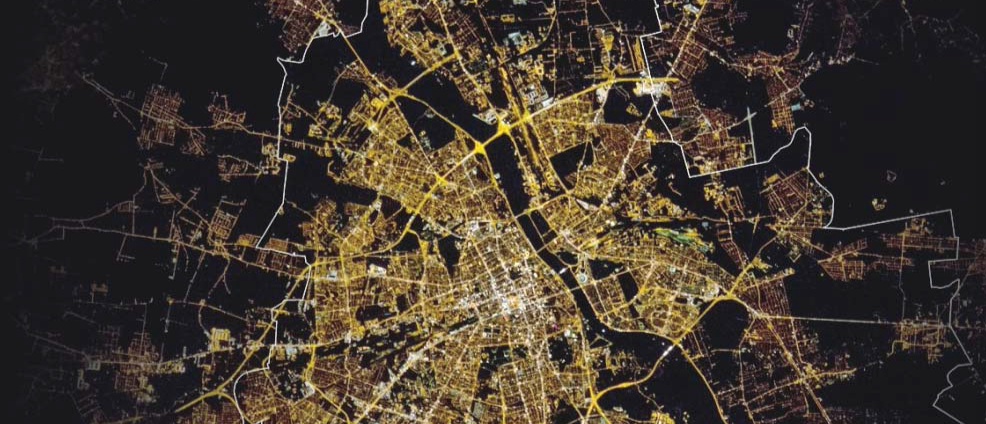
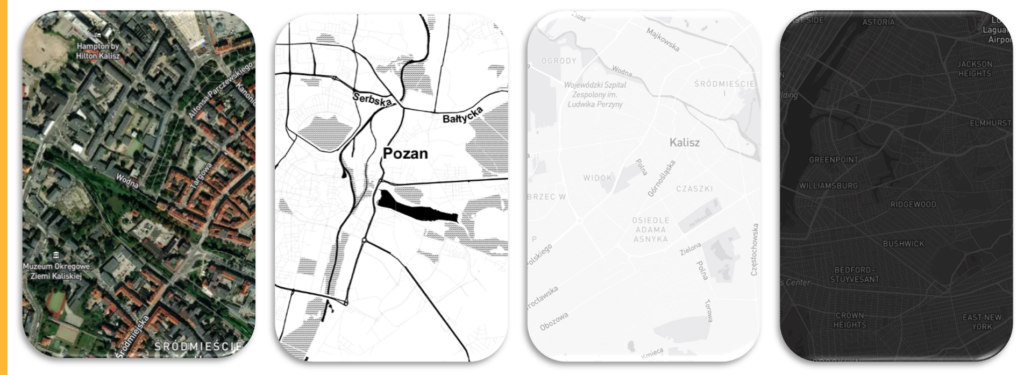
Road infrastructure database
- Black plans
- Color temperature map
- City structure

All data has been downloaded and the changes have been migrated and projects can be created. All you need to do is select the data layers you are interested in and they will appear in the project as layers. But they need to show up somehow, and in order to visually provide the desired information, you can change the data display style. ILS lighting control system has 3 styles; single, unique and gradual. What does it mean? Single displays data from one layer, unique shows the classification of occurring values, and gradual allows you to visualize the division of numerical values into intervals. Visual examples below.
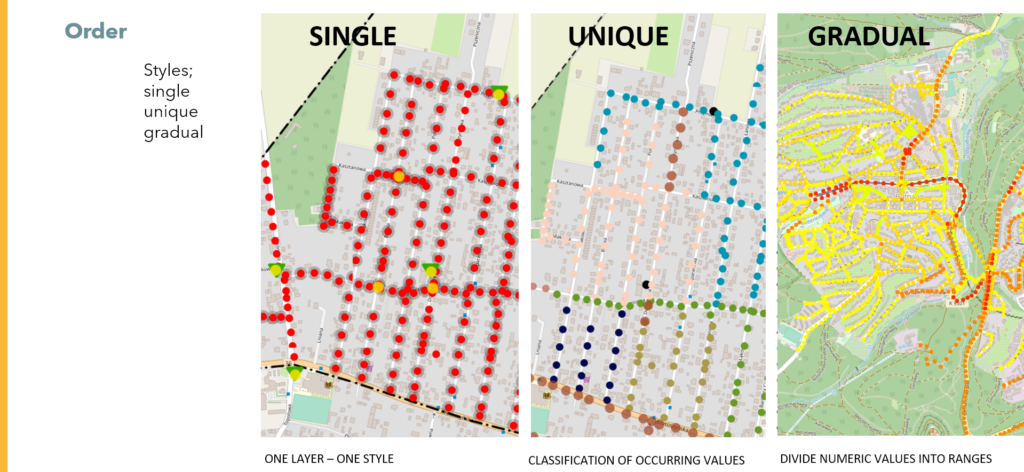
Additionally, individual symbolization can be added to point data or selected from the database of available symbols.
DATA VISUALIZATION IN THE SYSTEM
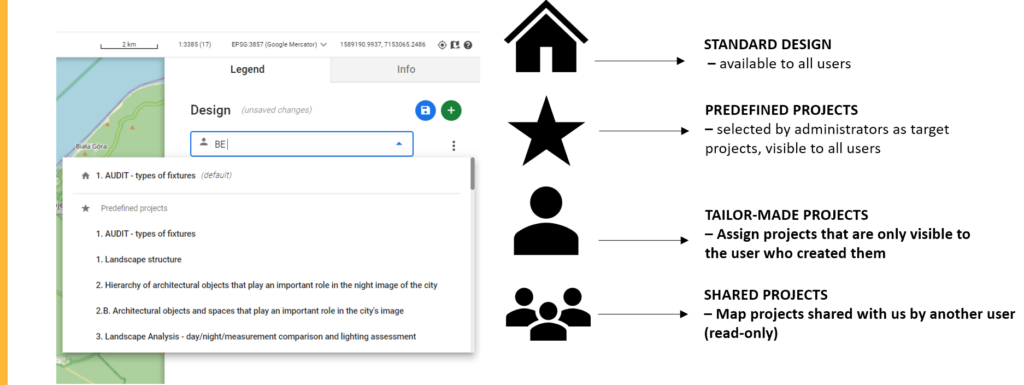
The beautiful new design is already done. But it was not made for one user. If you want other users of the application/lighting control system to have access to the project, just share it, just select the selected people on the list and the rest will have access to the project. However, no unauthorized person will influence the project. To be able to edit a project shared by someone, you must first save it, otherwise it is impossible, only the ability to change the visibility of layers is available.
That’s it for this part, in the next one a little about the actual calculations and the modernization process itself.
If you want to learn more about replacing lighting with ILS, click here.
And if you want to see the ILS system offer, click here. Complete the test to find out what you need.
Are you a practitioner? You won’t see it, you won’t believe it? Sure thing! You can arrange a presentation or read more about our implementations, e.g. in Świnoujście.